We address the perennial question about putting POS in retail outlets for FMCG, and how to measure return and effectiveness.
Measuring ROI on POS can be tricky for buyers and stores, especially when the answer influences future placement and investment. But how can it be tracked?
Knowing where and how much to invest, what areas need the big and bold displays to drive sales, and whether we should be pushing the brand or focussing on something else, are all essential questions – and only cover over-arching performance.
Digging down even deeper, we’d ideally like to know what sort of POS works in which kinds of stores – out of town, local express, big retailer? Does it work differently on different days of the week? How does it vary by product types or luxury vs commodity?
What would more knowledge on POS give us?
There are a wealth of ways we could be learning about POS placement to:
- print less (and save the planet)
- put in the right stores (and generate more sales)
- give the right information to consumers already faced with a dizzying array of choice (and give a better experience).
So why don’t we? Because, fundamentally, FMCG businesses only have real depth on two data points.
- What POS they sent to the store and its associated cost
- What level of product got sold and its associated income
And that’s not enough.
You need rich data to measure ROI on POS
To be fair, the previous two data points do give some degree of insight. One would like to think that if you send lots of POS to a big store and you see lots of product sales, there’s a relationship between the two. And there probably is, but it’s impossible to tell for sure, with no easily quantifiable data.
In many cases, we tend to place more POS where we get the most sales; and that can be self-fulfilling. Control stores are notoriously hard to implement on a like-for like basis in stores that can stock thousands of products, due to associated logistics and stock management.
There are also many other factors at play which create a lot of noise in interpreting those simple two data points and our own unconscious bias in where we place the marketing in the first place.
Separating the noise from the data
We need to question things like; did the POS even get to the store, did it make it out of the store room, did it get stocked adequately at the time it was expected to be, did it have the stand-out the creatives envisioned it having back in the concept stages?
And if it did make it to the right place at the right time with the right level of product on it, did customers appear to interact with it? Did it cause them to stop and enter the awareness, consideration or, dare we say it, purchase phase of the shopper journey?
And we’re not only talking about stock holding POS here – the same applies for any POS containing messaging and branding.
This isn’t a new challenge and it’s always been hard to do this at scale. We have tended to see that the stores with the best managers get the best results and that’s probably because they apply their judgement as to what the best POS is and use it in the right way for their store.
But that’s difficult to quantify, and therefore measure and apply at scale across multiple stores, in multiple locations, in multiple markets.
It is relatively cheap and easy to track the delivery of POS into a store via highly-developed technology. This simply requires an active interest by the store or department manager.
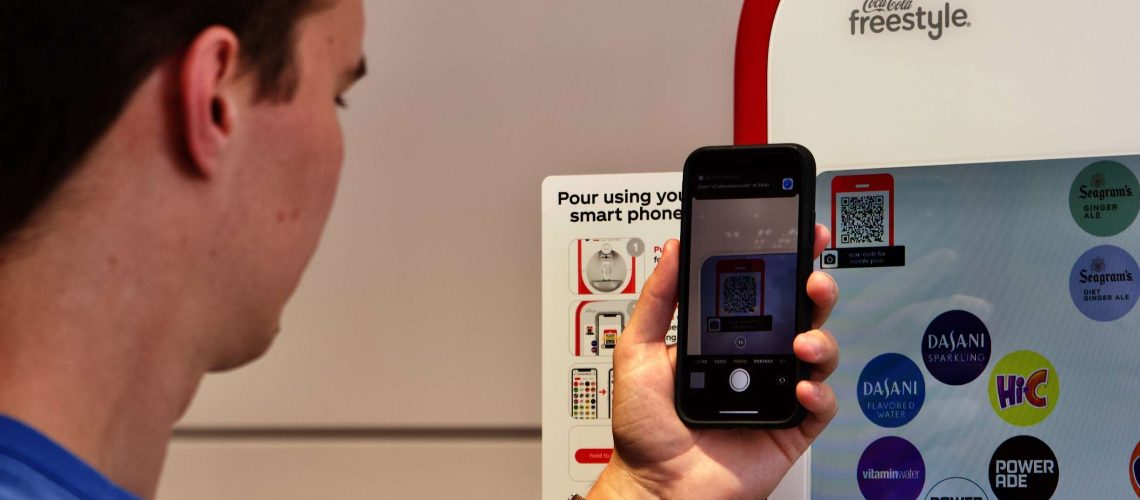
Proximity-based technologies, such as ibeacons or QR codes, that allow you to make purchases or interact with a brand through your phone, open up a wide range of ROI tracking, however these are limited to people comfortable using their device in that way.
How can we improve our ability to measure ROI on POS?
The Director of Public Policy at FiveAI expressed an interesting answer to the question. She suggested there is an opportunity to use Artificial Intelligence to learn about what works in the retail space.
FiveAI are an organisation working to understand how we’d organise ourselves to manage autonomous cars. They use AI to inform the policies and regulations required to deliver safe, reliable, and socially responsible automated transportation services.
They are using TFL CCTV as the input data for that learning exercise. It interprets images on a mass scale to learn how people make decisions and behave whilst driving. The system then extrapolates and applies that learning.
How can retailers use AI?
Retailers already have security cameras. They can already see what is happening in-store with their merchandise in a digital format. But what if there are restrictions on using that footage?
Then are also organisations that crowd-source imagery of POS stands and the customers interacting with them. Images can be collated and combined with the metadata of where they are, when they are installed, and what type of store they are in – geographically or demographically.
Once you connect that with product sales you can associate the actual investment of what people actually saw with income. And once you have that dataset, you can ask it anything you like in terms of performance metrics.
There’s no single answer to calculating ROI on POS and finding end to end performance measures on a mass scale.
Brands need to decide between picking two or three stores, undertaking a deep-dive one-off research project (both qualitative and quantitative), and then assuming all other stores will behave the same.
Or they can look for a means of mass measurement, and to do that, you need mass data input. AI may be the most effective way of transforming this data into something usable.


